MongoDB slow query profiler and index suggestions
The managed MongoDB runtime continuously parses the database server logs for slow queries (Queries that exceed 100ms in execution time) analyzes them and provides detailed analytics on the dashboard. The runtime also makes intelligent suggestions on the indexes that can be created to correct this issue if an index is not already in place.
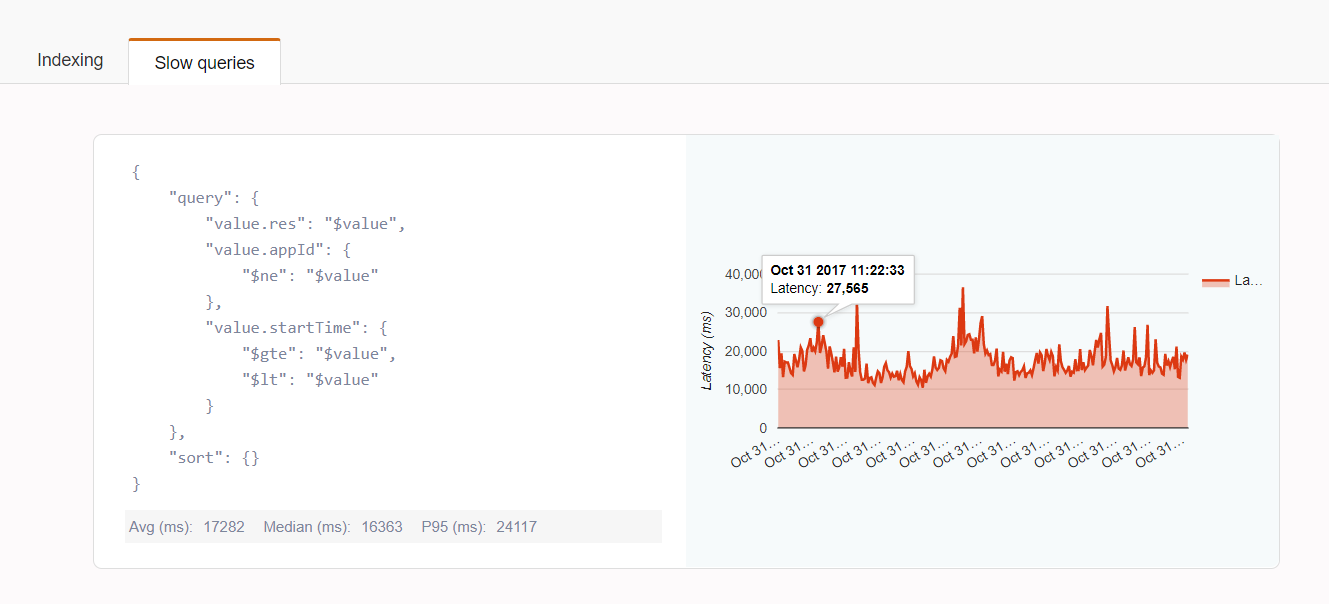
Slow queries
Slow queries are grouped by collection and then grouped by the query shape (The query without input values.). To access the slow query metrics from the dashboard, navigate to the Task manager, click on DB Actions → Slow Query Analyzer & Indexing. Click on a collection and then click on the slow queries tab to view all slow queries. Slow queries are sorted in descending order by the date when it executed on the server.
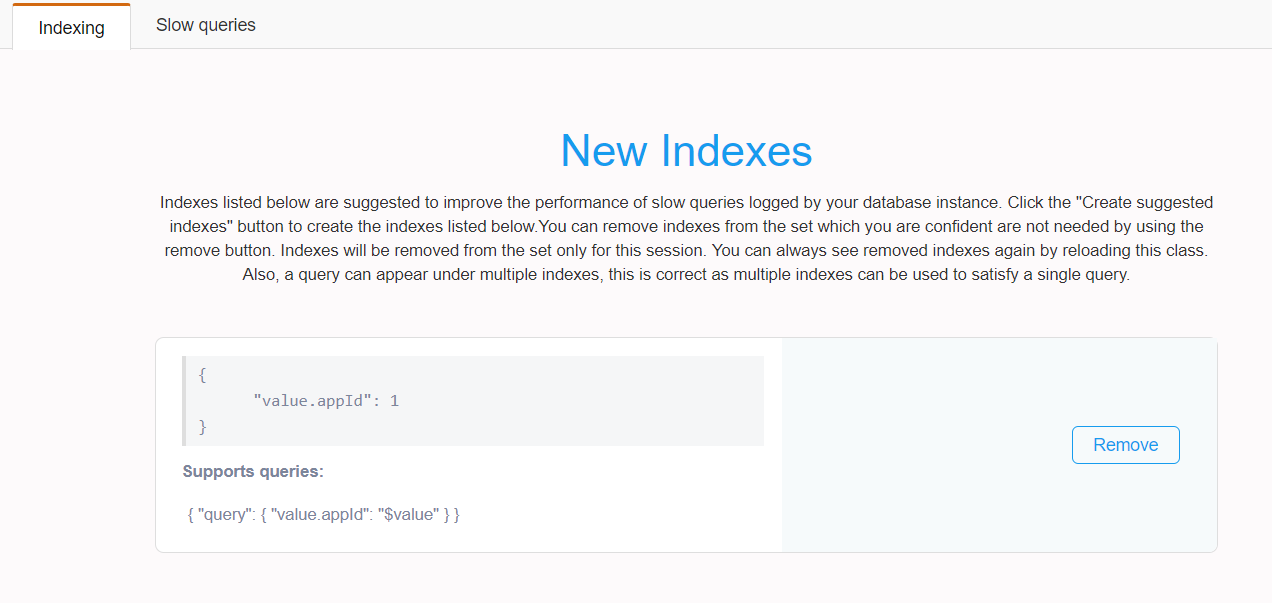
Index suggestions
Indexes are suggested to improve the performance of slow queries logged by your database instance. To access index suggestions, click on DB Actions → Slow Query Analyzer & Indexing. Select a class to view all suggested indexes. Click the "Create suggested indexes" button to create the indexes listed below. You can remove indexes from the set which you are confident are not needed by using the remove button. Indexes will be removed from the set only for this session. You can always see removed indexes again by reloading this class. Also, a query can appear under multiple indexes, this is correct as multiple indexes can be used to satisfy a single query.