Monitoring your MongoDB database
The NodeChef platform provides you all the neccesary information from the dashboard to monitor your database instance. This documents highlights various tools from the dashboard that can be used to monitor the database.
To monitor errors, the Mongo Logs shoukd be the authorative source on this information. You can access the database logs from DB Actions → Mongo Logs. In real-time, any errors that happen on the server will be printed on the dashboard. Errors are highlighted in red font. If you download your logs instead, each log entry is formatted into a JSON entry. You can identify error entries by checking the stream attribute of every JSON entry is equal to stderr after parsing.
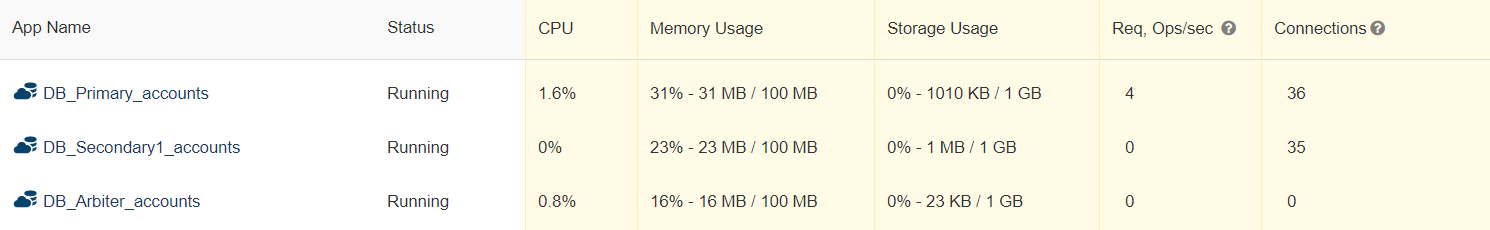
To monitor in real-time the CPU, Memory and Request/sec metrics of your database, this information should be available from the dashboard. The information provided displays resource utilization by your database in real-time.
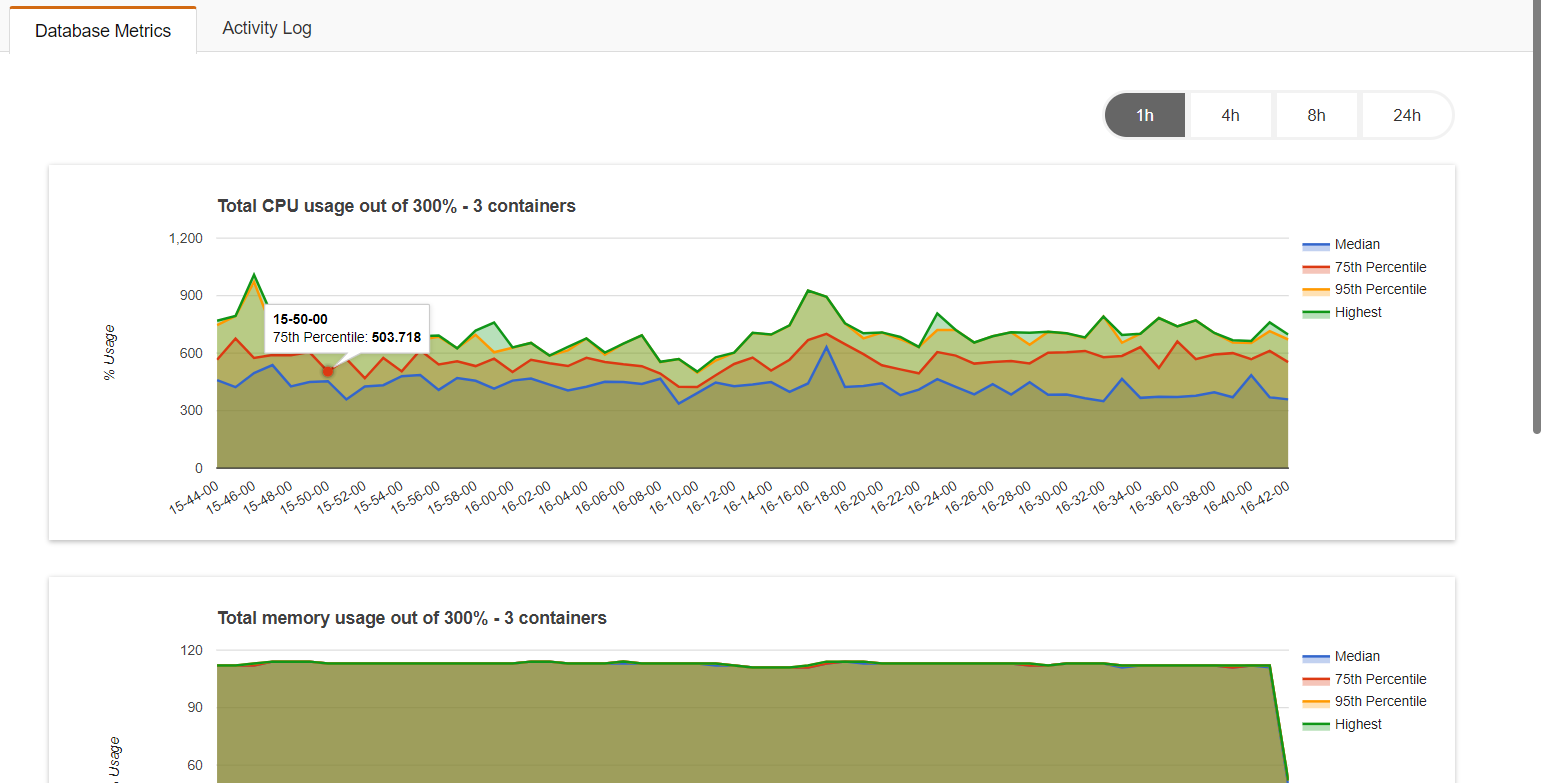
You can also review the historical CPU, Memory and Request/sec metrics for up to 24 hrs. To access historical metrics information, click on App insights → Select the Application and then click on Database metrics if not already selected.