Real-time monitoring.
You can monitor in real-time the memory, cpu profile of your app containers from the Task manager. You can also monitor the total requests dispatched
to your containers, total connected clients and websockets. All this information is available from the task manager.

-
State
Is the container running or down. If the container is down, this value should read "Exited" together with how long it has been down expressed in seconds,
minutes, hours, days depending on the exited time.
- CPU
The CPU column on the task manager displays the current CPU usage of your app container in real-time.
-
Memory usage
Displays the current memory usage of the container
-
Req / Sec
The total amount of requests dispatched to the App container in a second. If for example you have two app containers and each reads
"5/10" under this column, this means 10 requests were dispatched to your two App containers. The container on the row we are reviewing however received 5 of this request.
You can use this column to review how efficient the proxy is load balancing at any point in time.
-
Connections
This value is expressed as in 0, 0
The first number displays the current total open connections from clients.
The second number displays the total open web socket connections.
App insight
Review the metrics of your applications over a period of time.
To access this feature, Click on App insights from the dashboard and then the Name of your App. Click on the HTTP metrics section to review metrics collected
from the proxy, Use the App metrics to review the memory and CPU usage of your app containers
Metrics are grouped into the following measures
| Measure |
Description |
| Median |
The median is the value separating the higher half of the data sample from the lower half |
| 75th percentile |
Value below which 75% of the observations may be found |
| 95th percentile |
Value below which 95% of the observations may be found |
| Highest |
The highest value recorded for the time period. |
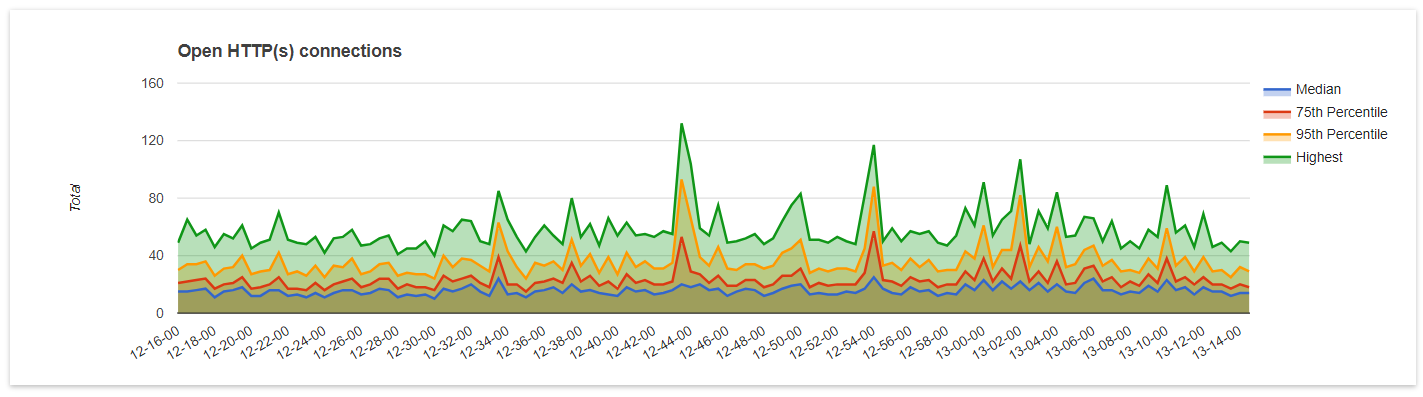
Open connections to the server metrics
The number of connections established at any point in time from your clients. The higher this number, it is possible your server might be slow responding to incomming request.
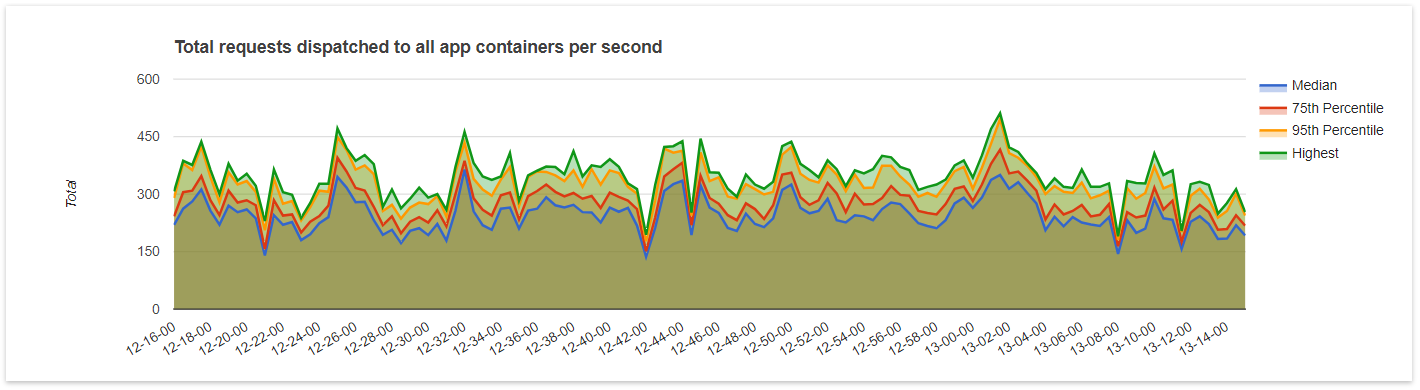
Request per second metrics
The total amount of requests dispatched to your app containers for which a response was received or timed out
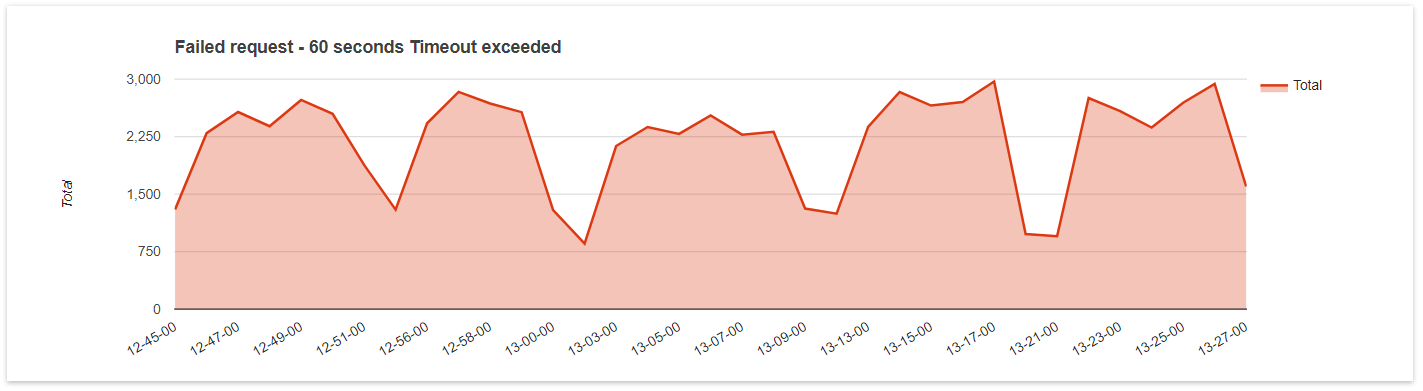
60 seconds timeout metrics
Displays the total amount of requests that failed to respond within the allowed 60 second period. If your app is designed to respond under 60 seconds, this metric could be
an indication of serious performance issues with the application as the example shown below.
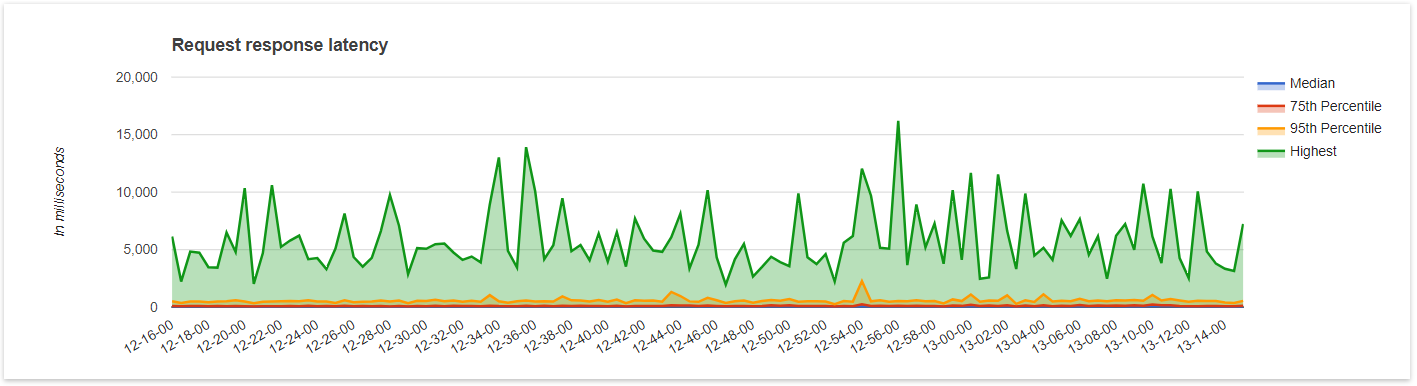
Response latency
Response latency in milliseconds. Displays metrics on the time elapsed between when the request was dispatched to your app container and when the response headers was recieved.
The lower the value for the 95th percentile measure, the better your app is performing overall. Although the highest value can be high in some cases, you should not be concerned
if most observations are generally lower. Infact other cloud platforms will not report this value.
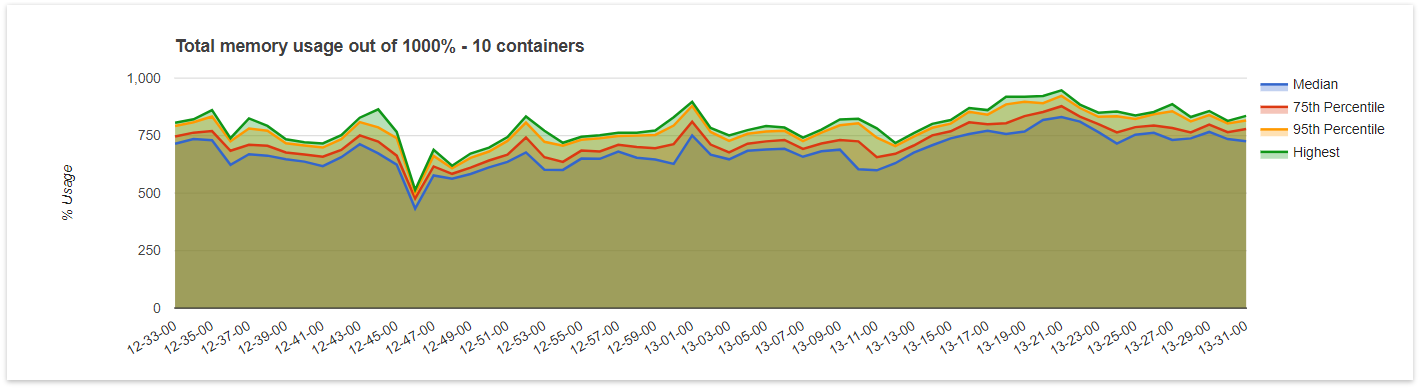
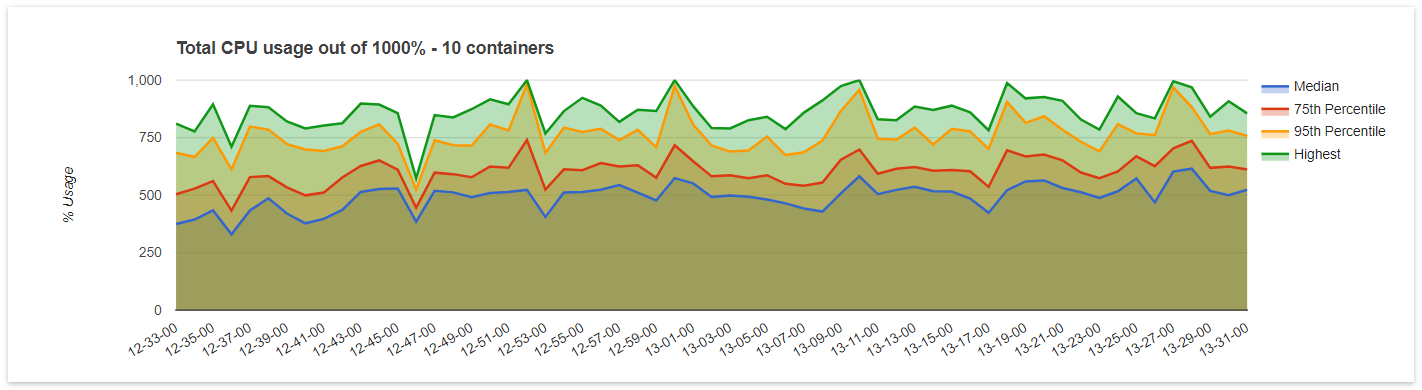
CPU
The CPU usage aggregated for all your app containers. Note it is possible for this value to exceed 100% or even the total number of containers multiplied by 100 as an
app container (Multi-threaded applications) could use 200% CPU at any point in time. This is possible because app containers typically have access to more than one core.
Memory