PostgreSQL slow query profiler
The platform continuously parses your database logs for slow executing statements. By default statements that require more than 2000 milliseconds are profiled. You can change this value anytime. Reference the configuring basic server settings documents on how to change this value.
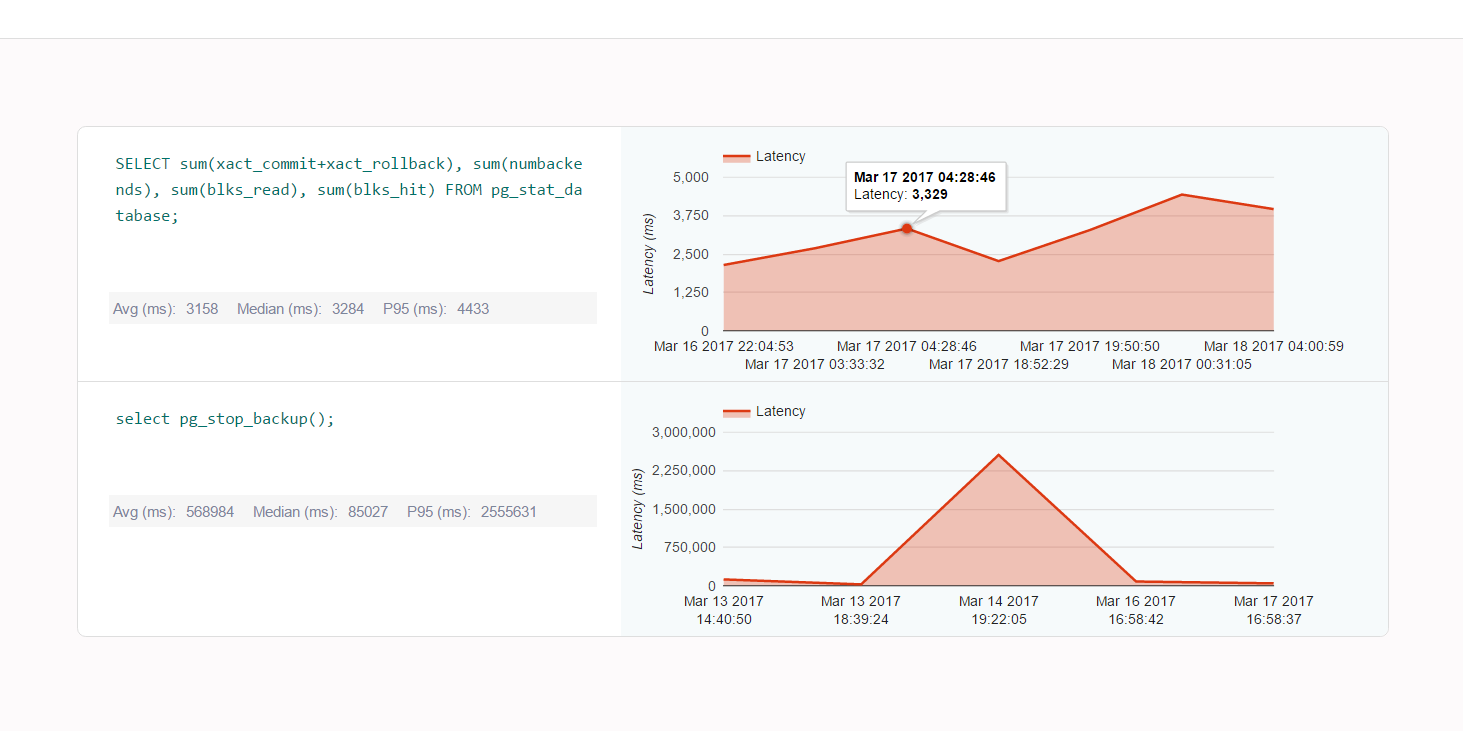
To view and analyze slow queries. Click on PGDB Actions → Slow query profiler from the Task Manager.